Multiple Choice
TABLE 10-17
A realtor wants to compare the mean sales-to-appraisal ratios of residential properties sold in four neighborhoods (A, B, C, and D) . Four properties are randomly selected from each neighborhood and the ratios recorded for each, as shown below.
A: 1.2, 1.1, 0.9, 0.4 C: 1.0, 1.5, 1.1, 1.3
B: 2.5, 2.1, 1.9, 1.6 D: 0.8, 1.3, 1.1, 0.7
Interpret the results of the analysis summarized in the following table:
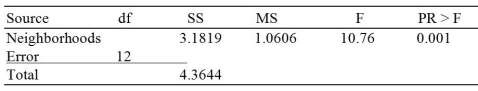
-Referring to Table 10-17, what should be the decision for the Levene's test for homogeneity of variances at a 5% level of significance?
A) Reject the null hypothesis because the p-value is smaller than the level of significance.
B) Reject the null hypothesis because the p-value is larger than the level of significance.
C) Do not reject the null hypothesis because the p-value is smaller than the level of significance.
D) Do not reject the null hypothesis because the p-value is larger than the level of significance.
Correct Answer:

Verified
Correct Answer:
Verified
Q7: TABLE 10-10<br>A corporation randomly selects 150 salespeople
Q13: The statistical distribution used for testing the
Q118: TABLE 10-4<br>Two samples each of size 25
Q123: TABLE 10-18<br>As part of an evaluation program,
Q127: TABLE 10-18<br>As part of an evaluation program,
Q131: TABLE 10-18<br>As part of an evaluation program,
Q132: TABLE 10-19<br>An agronomist wants to compare the
Q180: TABLE 10-5<br>To test the effectiveness of a
Q184: The F distribution can only have positive
Q190: In testing for the differences between the