Multiple Choice
TABLE 10-17
A realtor wants to compare the mean sales-to-appraisal ratios of residential properties sold in four neighborhoods (A, B, C, and D) . Four properties are randomly selected from each neighborhood and the ratios recorded for each, as shown below.
A: 1.2, 1.1, 0.9, 0.4 C: 1.0, 1.5, 1.1, 1.3
B: 2.5, 2.1, 1.9, 1.6 D: 0.8, 1.3, 1.1, 0.7
Interpret the results of the analysis summarized in the following table:
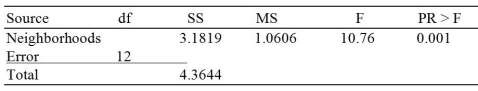
-Referring to Table 10-17, what should be the conclusion for the Levene's test for homogeneity of variances at a 5% level of significance?
A) There is insufficient evidence that the variances are all the same.
B) There is sufficient evidence that the variances are all the same.
C) There is insufficient evidence that the variances are not all the same.
D) There is sufficient evidence that the variances are not all the same.
Correct Answer:

Verified
Correct Answer:
Verified
Q35: TABLE 10-15<br>The table below presents the summary
Q163: TABLE 10-6<br>To investigate the efficacy of a
Q182: TABLE 10-7<br>A buyer for a manufacturing plant
Q184: TABLE 10-8<br>A few years ago, Pepsi invited
Q195: TABLE 10-20<br>A hotel chain has identically sized
Q196: TABLE 10-20<br>A hotel chain has identically sized
Q199: TABLE 10-19<br>An agronomist wants to compare the
Q199: TABLE 10-14<br>The use of preservatives by food
Q202: TABLE 10-8<br>A few years ago, Pepsi invited
Q206: TABLE 10-11<br>The dean of a college is