Multiple Choice
TABLE 12-2
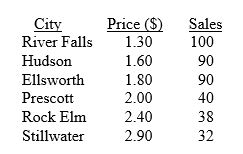
A candy bar manufacturer is interested in trying to estimate how sales are influenced by the price of their product. To do this, the company randomly chooses six small cities and offers the candy bar at different prices. Using candy bar sales as the dependent variable, the company will conduct a simple linear regression on the data below:
 .
.
-Referring to Table 12-2, what is the estimated mean change in the sales of the candy bar if price goes up by $1.00?
A) 161.386
B) 0.784
C) -3.810
D) -48.193
Correct Answer:

Verified
Correct Answer:
Verified
Q184: TABLE 12-4<br>The managers of a brokerage firm
Q185: TABLE 12-4<br>The managers of a brokerage firm
Q186: TABLE 12-11<br>A computer software developer would like
Q187: TABLE 12-10<br>The management of a chain electronic
Q188: TABLE 12-10<br>The management of a chain electronic
Q190: TABLE 12-7<br>An investment specialist claims that if
Q191: TABLE 12-2<br>A candy bar manufacturer is interested
Q191: The standard error of the estimate is
Q193: The sample correlation coefficient between X and
Q194: TABLE 12-4<br>The managers of a brokerage firm