Multiple Choice
TABLE 12-8
It is believed that GPA (grade point average, based on a four-point scale) should have a positive linear relationship with ACT scores. Given below is the Microsoft Excel output for predicting GPA using ACT scores based a data set of eight randomly chosen students from a Big Ten university.
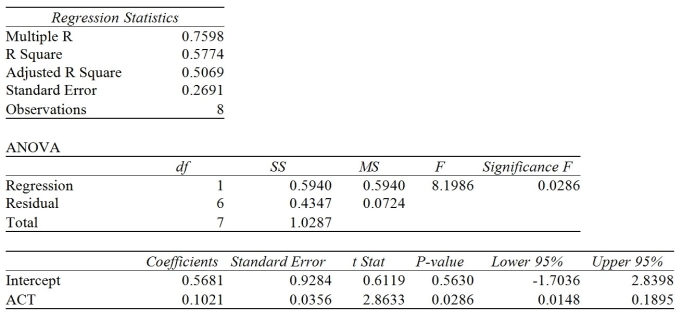
-Referring to Table 12-8, the interpretation of the coefficient of determination in this regression is:
A) 57.74% of the total variation of ACT scores can be explained by GPA.
B) ACT scores account for 57.74% of the total fluctuation in GPA.
C) GPA accounts for 57.74% of the variability of ACT scores.
D) none of the above
Correct Answer:

Verified
Correct Answer:
Verified
Q147: Regression analysis is used for prediction,while correlation
Q196: TABLE 12-3<br>The director of cooperative education at
Q197: TABLE 12-10<br>The management of a chain electronic
Q199: TABLE 12-11<br>A computer software developer would like
Q200: TABLE 12-10<br>The management of a chain electronic
Q202: TABLE 12-10<br>The management of a chain electronic
Q203: TABLE 12-6<br>The following Microsoft Excel tables are
Q204: TABLE 12-11<br>A computer software developer would like
Q205: TABLE 12-13<br>In this era of tough economic
Q206: TABLE 12-12<br>The manager of the purchasing department