Multiple Choice
TABLE 12-11
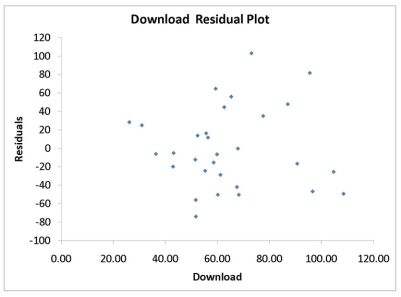
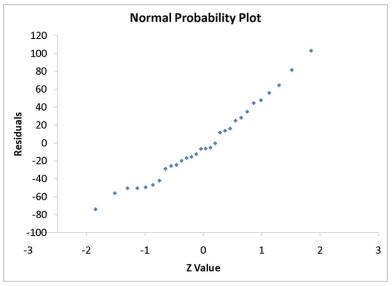
A computer software developer would like to use the number of downloads (in thousands) for the trial version of his new shareware to predict the amount of revenue (in thousands of dollars) he can make on the full version of the new shareware. Following is the output from a simple linear regression along with the residual plot and normal probability plot obtained from a data set of 30 different sharewares that he has developed:
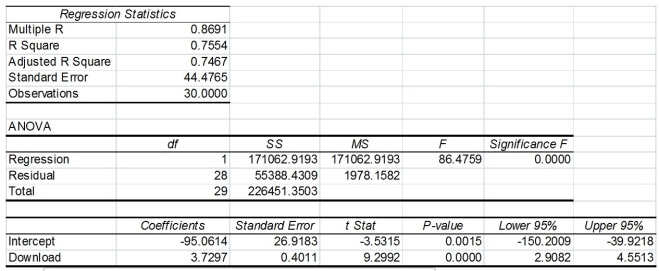
-Referring to Table 12-11, which of the following is the correct interpretation for the slope coefficient?
A) For each decrease of 1 thousand downloads, the expected revenue is estimated to increase by $3.7297 thousands.
B) For each increase of 1 thousand downloads, the expected revenue is estimated to increase by $3.7297 thousands.
C) For each decrease of 1 thousand dollars in expected revenue, the expected number of downloads is estimated to increase by 3.7297 thousands.
D) For each increase of 1 thousand dollars in expected revenue, the expected number of downloads is estimated to increase by 3.7297 thousands.
Correct Answer:

Verified
Correct Answer:
Verified
Q10: TABLE 12-4<br>The managers of a brokerage firm
Q11: TABLE 12-3<br>The director of cooperative education at
Q14: TABLE 12-11<br>A computer software developer would like
Q16: TABLE 12-4<br>The managers of a brokerage firm
Q17: TABLE 12-13<br>In this era of tough economic
Q18: TABLE 12-9<br>It is believed that, the average
Q19: TABLE 12-10<br>The management of a chain electronic
Q20: TABLE 12-3<br>The director of cooperative education at
Q169: In a simple linear regression problem, r
Q193: The sample correlation coefficient between X and