Short Answer
TABLE 12-11
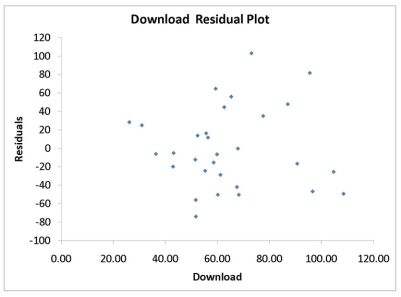
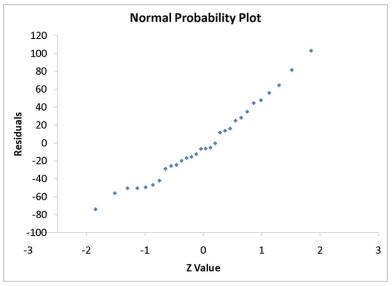
A computer software developer would like to use the number of downloads (in thousands) for the trial version of his new shareware to predict the amount of revenue (in thousands of dollars) he can make on the full version of the new shareware. Following is the output from a simple linear regression along with the residual plot and normal probability plot obtained from a data set of 30 different sharewares that he has developed:
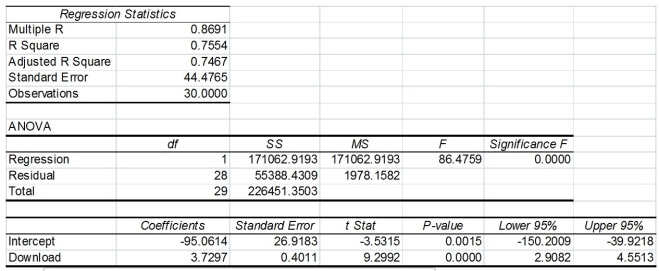
-Referring to Table 12-11, what are the lower and upper limits of the 95% confidence interval estimate for the mean change in revenue as a result of a 1 thousand increase in the number of downloads?
Correct Answer:

Verified
2.9082 and...View Answer
Unlock this answer now
Get Access to more Verified Answers free of charge
Correct Answer:
Verified
View Answer
Unlock this answer now
Get Access to more Verified Answers free of charge
Q164: TABLE 12-2<br>A candy bar manufacturer is interested
Q165: TABLE 12-3<br>The director of cooperative education at
Q166: If the plot of the residuals is
Q167: TABLE 12-4<br>The managers of a brokerage firm
Q168: TABLE 12-10<br>The management of a chain electronic
Q170: TABLE 12-11<br>A computer software developer would like
Q171: TABLE 12-2<br>A candy bar manufacturer is interested
Q172: TABLE 12-12<br>The manager of the purchasing department
Q173: The sample correlation coefficient between X and
Q174: TABLE 12-4<br>The managers of a brokerage firm