Short Answer
TABLE 12-13
In this era of tough economic conditions, voters increasingly ask the question: "Is the educational achievement level of students dependent on the amount of money the state in which they reside spends on education?" The partial computer output below is the result of using spending per student ($) as the independent variable and composite score, which is the sum of the math, science, and reading scores, as the dependent variable on 35 states that participated in a study. The table includes only partial results.
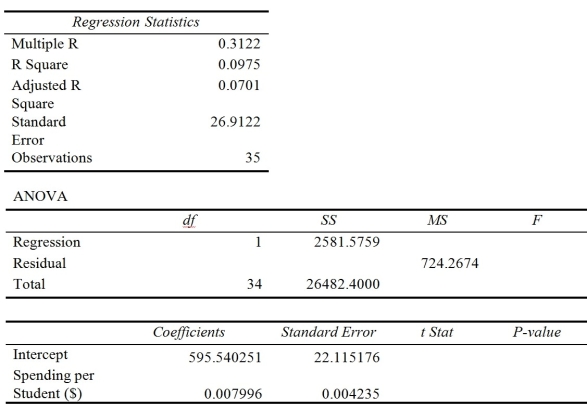
-Referring to Table 12-13, what percentage of the variation in composite score can be explained by the variation in spending per student?
Correct Answer:

Verified
Correct Answer:
Verified
Q83: TABLE 12-8<br>It is believed that GPA (grade
Q84: TABLE 12-3<br>The director of cooperative education at
Q85: TABLE 12-3<br>The director of cooperative education at
Q86: TABLE 12-8<br>It is believed that GPA (grade
Q87: TABLE 12-3<br>The director of cooperative education at
Q89: TABLE 12-4<br>The managers of a brokerage firm
Q90: If you wanted to find out if
Q92: TABLE 12-12<br>The manager of the purchasing department
Q93: TABLE 12-8<br>It is believed that GPA (grade
Q194: You give a pre-employment examination to your