Multiple Choice
A researcher wants to explore the relationship between cricket chirps and temperature.The following scatterplot shows data collected over a random sample of 8 days.Each day, the temperature was recorded, as well as the number of times a cricket chirped in 15 seconds.According to this scatterplot, what can be said (if anything) about the relationship between cricket chirps and temperature? 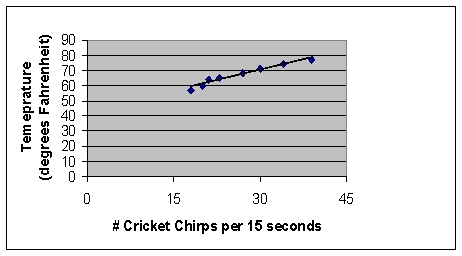
A) There appears to be a strong positive linear relationship.
B) There appears to be a weak linear relationship because the slope of the line is fairly flat.
C) There can't be a relationship; cricket chirps can't be related to temperature.
D) None of the above.
Correct Answer:

Verified
Correct Answer:
Verified
Q8: For Questions , use the following narrative<br>Narrative:
Q9: For Questions , use the following narrative<br>Narrative:
Q10: For Questions , use the following narrative<br>Narrative:
Q11: Most researchers are willing to declare that
Q12: For Questions , use the following narrative<br>Narrative:
Q14: A relationship is considered to be statistically
Q15: Explain how a relationship may exist between
Q16: Statistical relationships such as correlation are useful
Q17: For Questions , use the following narrative<br>Narrative:
Q18: To be convincing, an observed relationship must