Essay
For Questions use the following narrative:
Narrative: Average hourly earnings
The graph below, done in 1998 by the Bureau of Labor Statistics, represents the average hourly earnings of U.S.workers from 1947-1998 (in 1998 dollars).
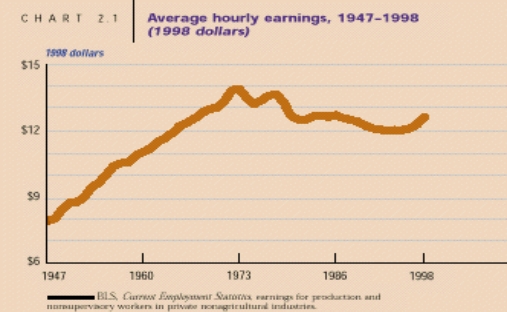
-{Average hourly earnings narrative} The designers of this graph expressed all their data in terms of 1998 dollars.Explain why they did this, and whether or not you think this is a good idea.
Correct Answer:

Verified
It is important to use fair an...View Answer
Unlock this answer now
Get Access to more Verified Answers free of charge
Correct Answer:
Verified
View Answer
Unlock this answer now
Get Access to more Verified Answers free of charge
Q39: Name one way in which a time
Q40: Use the following narrative: Narrative: Lottery dollar.
Q41: Most time series contain the same four
Q42: In what way(s) can a poorly done
Q43: Name two of the five most common
Q45: The following is an example of what
Q46: Explain why it is not wise to
Q47: A(n) _ is useful for displaying the
Q48: Measurement data displayed in terms of how
Q49: Which of the following describes the result