Multiple Choice
TABLE 13-3
An economist is interested to see how consumption for an economy (in $billions) is influenced by gross domestic product ($billions) and aggregate price (consumer price index) . The Microsoft Excel output of this regression is partially reproduced below.
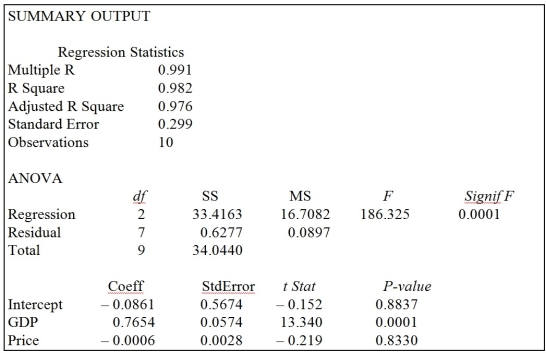
-Referring to Table 13-3, when the economist used a simple linear regression model with consumption as the dependent variable and GDP as the independent variable, he obtained an r² value of 0.971. What additional percentage of the total variation of consumption has been explained by including aggregate prices in the multiple regression?
A) 98.2
B) 11.1
C) 2.8
D) 1.1
Correct Answer:

Verified
Correct Answer:
Verified
Q163: TABLE 13-17<br>Given below are results from the
Q164: TABLE 13-8<br>A financial analyst wanted to examine
Q165: TABLE 13-11<br>A weight-loss clinic wants to use
Q166: TABLE 13-10<br>You worked as an intern at
Q167: TABLE 13-16<br>What are the factors that determine
Q169: TABLE 13-7<br>The department head of the accounting
Q170: TABLE 13-17<br>Given below are results from the
Q171: TABLE 13-15<br>The superintendent of a school district
Q172: TABLE 13-15<br>The superintendent of a school district
Q173: TABLE 13-3<br>An economist is interested to see