Multiple Choice
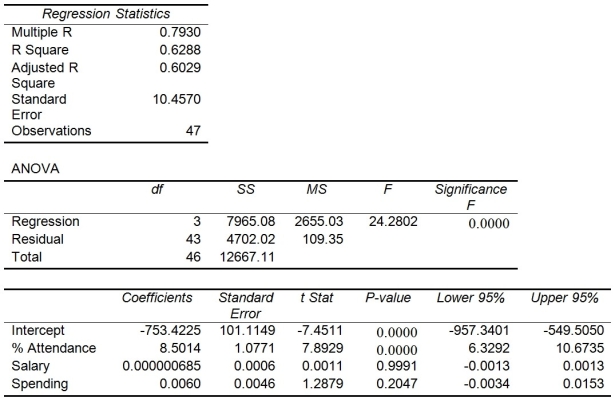
TABLE 13-15
The superintendent of a school district wanted to predict the percentage of students passing a sixth-grade proficiency test. She obtained the data on percentage of students passing the proficiency test (% Passing) , daily mean of the percentage of students attending class (% Attendance) , mean teacher salary in dollars (Salaries) , and instructional spending per pupil in dollars (Spending) of 47 schools in the state.
Following is the multiple regression output with Y = % Passing as the dependent variable,  = : % Attendance,
  = Salaries and
  = Spending:

-Referring to Table 13-15, which of the following is the correct alternative hypothesis to determine whether there is a significant relationship between percentage of students passing the proficiency test and the entire set of explanatory variables?
A) H₁: β₀ = β₁ = β₂ = β₃ ≠ 0
B) H₁: β₁ = β₂ = β₃ ≠ 0
C) H₁: At least one of βⱼ ≠ 0 for j = 0, 1, 2, 3
D) H₁: At least one of βⱼ ≠ 0 for j = 1, 2, 3
Correct Answer:

Verified
Correct Answer:
Verified
Q49: The interpretation of the slope is different
Q83: TABLE 13-9<br>You decide to predict gasoline prices
Q84: TABLE 13-7<br>The department head of the accounting
Q85: TABLE 13-11<br>A weight-loss clinic wants to use
Q86: TABLE 13-15<br>The superintendent of a school district
Q88: TABLE 13-8<br>A financial analyst wanted to examine
Q89: TABLE 13-17<br>Given below are results from the
Q90: TABLE 13-16<br>What are the factors that determine
Q91: TABLE 13-17<br>Given below are results from the
Q92: TABLE 13-15<br>The superintendent of a school district