Short Answer
TABLE 13-15
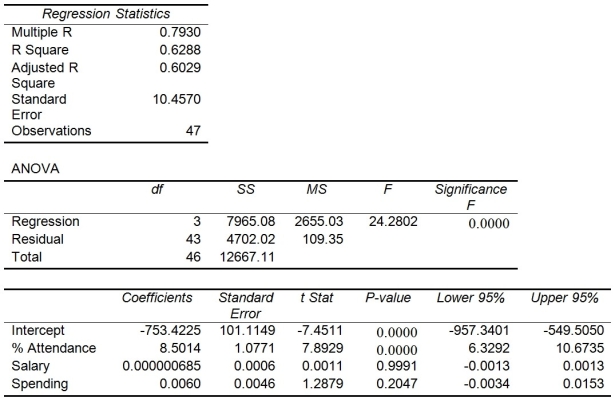
The superintendent of a school district wanted to predict the percentage of students passing a sixth-grade proficiency test. She obtained the data on percentage of students passing the proficiency test (% Passing), daily mean of the percentage of students attending class (% Attendance), mean teacher salary in dollars (Salaries), and instructional spending per pupil in dollars (Spending) of 47 schools in the state.
Following is the multiple regression output with Y = % Passing as the dependent variable,  = : % Attendance,
  = Salaries and
  = Spending:

-Referring to Table 13-15, what is the p-value of the test statistic to determine whether there is a significant relationship between percentage of students passing the proficiency test and the entire set of explanatory variables?
Correct Answer:

Verified
2.3853E−09...View Answer
Unlock this answer now
Get Access to more Verified Answers free of charge
Correct Answer:
Verified
View Answer
Unlock this answer now
Get Access to more Verified Answers free of charge
Q121: TABLE 13-7<br>The department head of the accounting
Q122: TABLE 13-2<br>A professor of industrial relations believes
Q123: TABLE 13-3<br>An economist is interested to see
Q124: TABLE 13-15<br>The superintendent of a school district
Q125: TABLE 13-3<br>An economist is interested to see
Q127: TABLE 13-17<br>Given below are results from the
Q128: TABLE 13-16<br>What are the factors that determine
Q129: TABLE 13-8<br>A financial analyst wanted to examine
Q130: TABLE 13-15<br>The superintendent of a school district
Q294: When an additional explanatory variable is introduced