Solved

TABLE 13-17 Given Below Are Results from the Regression Analysis Where the Where

Question 4

Multiple Choice

TABLE 13-17
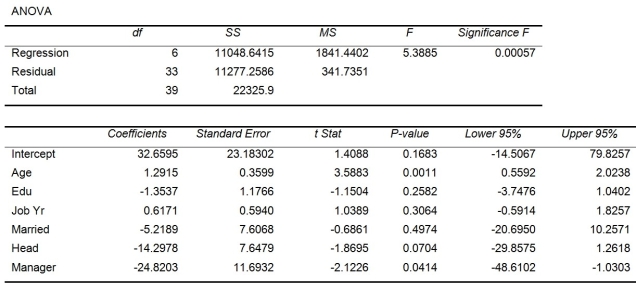
Given below are results from the regression analysis where the dependent variable is the number of weeks a worker is unemployed due to a layoff (Unemploy) and the independent variables are the age of the worker (Age) , the number of years of education received (Edu) , the number of years at the previous job (Job Yr) , a dummy variable for marital status (Married: 1 = married, 0 = otherwise) , a dummy variable for head of household (Head: 1 = yes, 0 = no) and a dummy variable for management position (Manager: 1 = yes, 0 = no) . We shall call this Model 1.
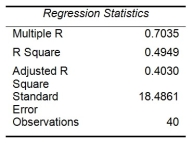
TABLE 13-17 Given below are results from the regression analysis where the dependent variable is the number of weeks a worker is unemployed due to a layoff (Unemploy)  and the independent variables are the age of the worker (Age) , the number of years of education received (Edu) , the number of years at the previous job (Job Yr) , a dummy variable for marital status (Married: 1 = married, 0 = otherwise) , a dummy variable for head of household (Head: 1 = yes, 0 = no)  and a dummy variable for management position (Manager: 1 = yes, 0 = no) . We shall call this Model 1.         Model 2 is the regression analysis where the dependent variable is Unemploy and the independent variables are Age and Manager. The results of the regression analysis are given below:        -Referring to Table 13-17 Model 1, which of the following is the correct alternative hypothesis to determine whether there is a significant relationship between percentage of students passing the proficiency test and the entire set of explanatory variables? A)  H₁: All βⱼ ≠ 0 for j = 0, 1, 2, 3, 4, 5, 6 B)  H₁: All βⱼ ≠ 0 for j = 1, 2, 3, 4, 5, 6 C)  H₁: At least one of βⱼ ≠ 0 for j = 0, 1, 2, 3, 4, 5, 6 D)  H₁: At least one of βⱼ ≠ 0 for j = 1, 2, 3, 4, 5, 6
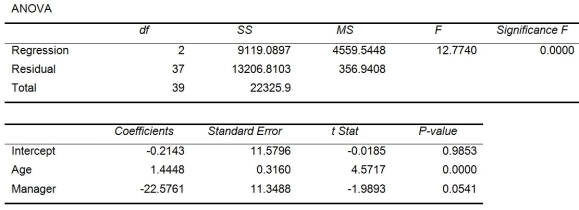
Model 2 is the regression analysis where the dependent variable is Unemploy and the independent variables are Age and Manager. The results of the regression analysis are given below:
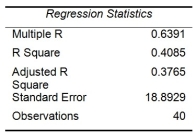
TABLE 13-17 Given below are results from the regression analysis where the dependent variable is the number of weeks a worker is unemployed due to a layoff (Unemploy)  and the independent variables are the age of the worker (Age) , the number of years of education received (Edu) , the number of years at the previous job (Job Yr) , a dummy variable for marital status (Married: 1 = married, 0 = otherwise) , a dummy variable for head of household (Head: 1 = yes, 0 = no)  and a dummy variable for management position (Manager: 1 = yes, 0 = no) . We shall call this Model 1.         Model 2 is the regression analysis where the dependent variable is Unemploy and the independent variables are Age and Manager. The results of the regression analysis are given below:        -Referring to Table 13-17 Model 1, which of the following is the correct alternative hypothesis to determine whether there is a significant relationship between percentage of students passing the proficiency test and the entire set of explanatory variables? A)  H₁: All βⱼ ≠ 0 for j = 0, 1, 2, 3, 4, 5, 6 B)  H₁: All βⱼ ≠ 0 for j = 1, 2, 3, 4, 5, 6 C)  H₁: At least one of βⱼ ≠ 0 for j = 0, 1, 2, 3, 4, 5, 6 D)  H₁: At least one of βⱼ ≠ 0 for j = 1, 2, 3, 4, 5, 6
-Referring to Table 13-17 Model 1, which of the following is the correct alternative hypothesis to determine whether there is a significant relationship between percentage of students passing the proficiency test and the entire set of explanatory variables?


A) H₁: All βⱼ ≠ 0 for j = 0, 1, 2, 3, 4, 5, 6
B) H₁: All βⱼ ≠ 0 for j = 1, 2, 3, 4, 5, 6
C) H₁: At least one of βⱼ ≠ 0 for j = 0, 1, 2, 3, 4, 5, 6
D) H₁: At least one of βⱼ ≠ 0 for j = 1, 2, 3, 4, 5, 6

Correct Answer:

verifed

Verified

Unlock this answer now
Get Access to more Verified Answers free of charge

Related Questions