Short Answer
TABLE 13-17
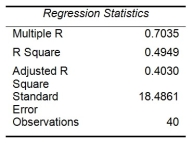
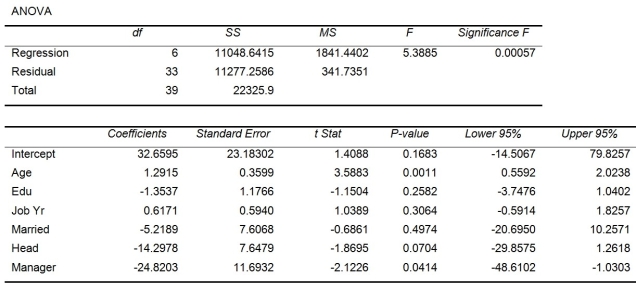
Given below are results from the regression analysis where the dependent variable is the number of weeks a worker is unemployed due to a layoff (Unemploy) and the independent variables are the age of the worker (Age), the number of years of education received (Edu), the number of years at the previous job (Job Yr), a dummy variable for marital status (Married: 1 = married, 0 = otherwise), a dummy variable for head of household (Head: 1 = yes, 0 = no) and a dummy variable for management position (Manager: 1 = yes, 0 = no). We shall call this Model 1.


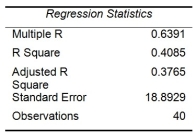
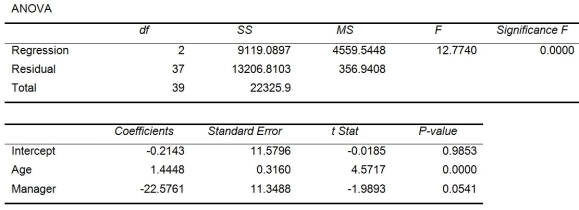
Model 2 is the regression analysis where the dependent variable is Unemploy and the independent variables are Age and Manager. The results of the regression analysis are given below:


-Referring to Table 13-17 Model 1, what are the lower and upper limits of the 95% confidence interval estimate for the effect of a one year increase in education received on the mean number of weeks a worker is unemployed due to a layoff after taking into consideration the effect of all the other independent variables?
Correct Answer:

Verified
Correct Answer:
Verified
Q37: The total sum of squares (SST)in a
Q194: In trying to construct a model to
Q197: TABLE 13-17<br>Given below are results from the
Q198: TABLE 13-5<br>A microeconomist wants to determine how
Q199: TABLE 13-15<br>The superintendent of a school district
Q200: TABLE 13-17<br>Given below are results from the
Q201: TABLE 13-17<br>Given below are results from the
Q204: TABLE 13-5<br>A microeconomist wants to determine how
Q206: TABLE 13-17<br>Given below are results from the
Q207: TABLE 13-5<br>A microeconomist wants to determine how