Multiple Choice
TABLE 14-3
A quality control analyst for a light bulb manufacturer is concerned that the time it takes to produce a batch of light bulbs is too erratic. Accordingly, the analyst randomly surveys 10 production periods each day for 14 days and records the sample mean and range for each day.
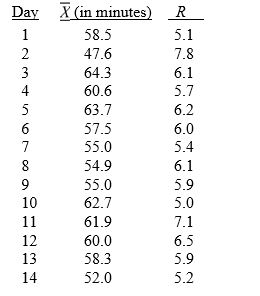
-Referring to Table 14-3, suppose the analyst constructs an R chart to see if the variability in production times is in control. The R chart is characterized by which of the following?
A) increasing trend
B) decreasing trend
C) in control
D) points outside the control limits
Correct Answer:

Verified
Correct Answer:
Verified
Q47: TABLE 14-8<br>Recently, a university switched to a
Q48: TABLE 14-9<br>The manufacturer of canned food constructed
Q49: One of the morals of the red
Q50: TABLE 14-7<br>A supplier of silicone sheets for
Q51: TABLE 14-4<br>A factory supervisor is concerned that
Q53: TABLE 14-7<br>A supplier of silicone sheets for
Q54: TABLE 14-8<br>Recently, a university switched to a
Q55: TABLE 14-2<br>A political pollster randomly selects a
Q56: TABLE 14-8<br>Recently, a university switched to a
Q57: A process is said to be out