Multiple Choice
TABLE 14-4
A factory supervisor is concerned that the time it takes workers to complete an important production task (measured in seconds) is too erratic and adversely affects expected profits. The supervisor proceeds by randomly sampling 5 individuals per hour for a period of 10 hours. The sample mean and range for each hour are listed below.
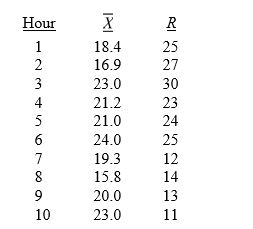
She also decides that lower and upper specification limit for the critical-to-quality variable should be 10 and 30 seconds, respectively.
-Referring to Table 14-4, suppose the sample mean and range data were based on 6 observations per hour instead of 5. How would this change affect the lower and upper control limits of an R chart?
A) LCL would increase; UCL would decrease.
B) LCL would remain the same; UCL would decrease.
C) Both LCL and UCL would remain the same.
D) LCL would decrease; UCL would increase.
Correct Answer:

Verified
Correct Answer:
Verified
Q12: Determining the root causes of why defects
Q31: Once the control limits are set for
Q38: TABLE 14-8<br>Recently, a university switched to a
Q39: TABLE 14- 1<br>A local newspaper has 10
Q41: TABLE 14-7<br>A supplier of silicone sheets for
Q43: TABLE 14-5<br>A manufacturer of computer disks took
Q46: TABLE 14-8<br>Recently, a university switched to a
Q47: TABLE 14-8<br>Recently, a university switched to a
Q53: Common causes of variation are correctable without
Q155: Which of the following is not part