Essay
TABLE 14-5
A manufacturer of computer disks took samples of 240 disks on 15 consecutive days. The number of disks with bad sectors was determined for each of these samples. The results are in the table that follows. 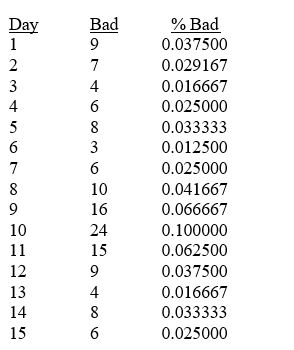
-Referring to Table 14-5, construct a p control chart for these data.
Correct Answer:

Verified
Correct Answer:
Verified
Q27: TABLE 14-9<br>The manufacturer of canned food constructed
Q28: TABLE 14-8<br>Recently, a university switched to a
Q30: TABLE 14-9<br>The manufacturer of canned food constructed
Q31: TABLE 14-7<br>A supplier of silicone sheets for
Q31: Once the control limits are set for
Q33: TABLE 14-4<br>A factory supervisor is concerned that
Q34: TABLE 14-4<br>A factory supervisor is concerned that
Q35: TABLE 14-7<br>A supplier of silicone sheets for
Q36: TABLE 14-9<br>The manufacturer of canned food constructed
Q71: The Shewhart-Deming cycle plays an important role