Short Answer
TABLE 14-6
The maker of a packaged candy wants to evaluate the quality of her production process. On each of 16 consecutive days, she samples 600 bags of candy and determines the number in each day's sample that she considers to be of poor quality. The data that she developed follow. 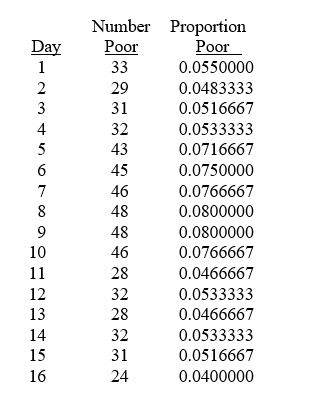
-Referring to Table 14-6, a p control chart is to be constructed for these data. The estimate of the standard error of the sample proportion is ________.
Correct Answer:

Verified
Correct Answer:
Verified
Q37: Maintaining the gains that have been made
Q68: TABLE 14-8<br>Recently, a university switched to a
Q69: TABLE 14-7<br>A supplier of silicone sheets for
Q70: TABLE 14-6<br>The maker of a packaged candy
Q71: TABLE 14-9<br>The manufacturer of canned food constructed
Q74: TABLE 14-7<br>A supplier of silicone sheets for
Q77: TABLE 14-8<br>Recently, a university switched to a
Q78: TABLE 14-3<br>A quality control analyst for a
Q139: Variation due to the inherent variability in
Q156: The control limits are based on the