Multiple Choice
The graph below represents a wave function (x) for a particle confined to -2.00 m x +2.00 m.The value of the normalisation constant A may be: 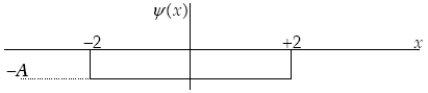
A) 
B) 
C) 
D) 
E) either or 

Correct Answer:

Verified
Correct Answer:
Verified
Related Questions
Q4: A baseball (1 kg)has an energy
Q6: The fact that we can only calculate
Q17: Calculate the ground state energy (in eV)
Q27: What is the quantum number n of
Q28: When the potential energy of a system
Q29: An electron has been accelerated by
Q30: A 15-kg mass, attached to a massless
Q33: Because of Heisenberg's Uncertainty Principle, the velocity
Q33: Classically, the concept of "tunneling" is impossible.
Q36: The average position, or expectation value,