Multiple Choice
The graph below shows the value of the probability density (x) |2 in the region-3.00 m x +3.00 m.The value of the constant A is: 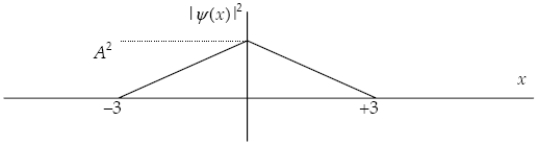
A) 
B) 
C) 
D) 
E) either or 

Correct Answer:

Verified
Correct Answer:
Verified
Related Questions
Q11: The wave function for a particle
Q12: If the position of an electron (m
Q13: A particle in a finite potential
Q14: A particle is in the second excited
Q17: If the interaction of a particle with
Q18: Because the factor h on the
Q19: A particle is in the ground state
Q21: The ground state energy of a harmonic
Q23: An electron is sitting on a
Q58: Suppose we use optical radiation (