Multiple Choice
Graph 22-2 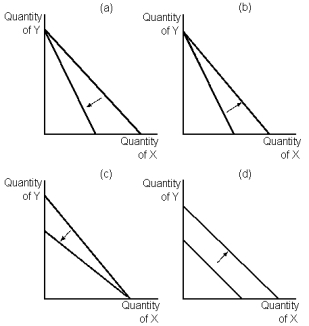
-Refer to Graph 22-2.Which of the graphs shown reflects an increase in income?
A) A
B) B
C) C
D) D
Correct Answer:

Verified
Correct Answer:
Verified
Related Questions
Q14: A consumer's set of indifference curves provides
Q15: If demand for a good falls as
Q16: Indifference curves provide a way to graphically
Q17: When a budget constraint shifts out:<br>(i) the
Q18: As long as a consumer is on
Q20: Which of the following statements is correct?
Q21: Janet knows that she will ultimately face
Q22: An upward-sloping individual labour supply curve is
Q23: As a general rule, the theory of
Q24: When two goods are perfect substitutes, the