Multiple Choice
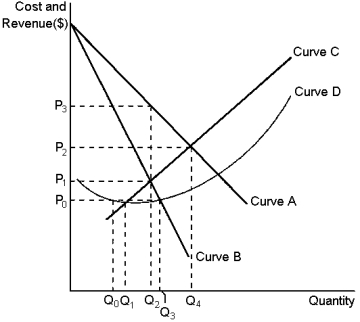
Graph 15-2  This graph reflects the cost and revenue structure for a monopoly firm.Use the graph to answer the following question(s) .
-Refer to Graph 15-2.If the monopoly firm is currently producing output at a level of Q₃, reducing output will always cause profit to:
A) increase as long as output is at least Q₂
B) increase as long as output is at least Q₁
C) remain unchanged
D) decrease
Correct Answer:

Verified
Correct Answer:
Verified
Q129: According to the information provided, if dozens
Q130: For a monopoly market, total surplus can
Q132: Consider a profit-maximising monopoly pricing under the
Q133: Total welfare when a monopoly can perfectly
Q135: If the current price charged by a
Q136: An important assumption about a monopoly is
Q137: A monopoly will be maximising total welfare
Q138: Which of the following statements is(are) true
Q139: Using the above information, if the publisher
Q187: Airlines often separate their customers into business