Multiple Choice
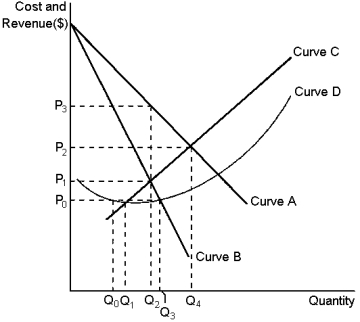
Graph 15-2  This graph reflects the cost and revenue structure for a monopoly firm.Use the graph to answer the following question(s) .
-Refer to Graph 15-2.Profit can always be increased by decreasing the level of output by one unit if the monopolist is currently operating at which of the following output levels?
(i) q₀
(ii) Q₁
(iii) Q₂
(iv) Q₃
A) (i) or (ii)
B) (i) , (ii) or (iii)
C) (iii) or (iv)
D) (iv) only
Correct Answer:

Verified
Correct Answer:
Verified
Q37: Perfect price discrimination describes a situation in
Q38: The socially efficient level of production occurs
Q39: A profit-maximising monopolist chooses the output level
Q40: If a firm's average total cost is
Q41: Another form of price discrimination is when
Q43: In a monopoly, the firm demand-curve and
Q44: Which of the following is likely to
Q45: Using the above information, how much higher
Q46: A perfectly price-discriminating monopolist is able to:<br>A)maximise
Q47: Because monopoly firms do not have to