Multiple Choice
Graph 15-3 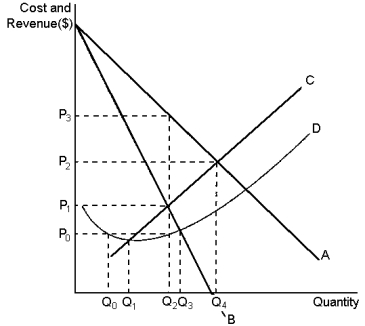 This graph reflects the cost and revenue structure for a monopoly firm.Use the graph to answer the following question(s) .
-Refer to Graph 15-3.Profit on a typical unit sold for a profit-maximising monopoly would equal:
A) P₃ - P₂
B) P₃ - P₀
C) P₂ - P₁
D) P₂ - P₀
Correct Answer:

Verified
Correct Answer:
Verified
Q202: Which of the following scenarios best represents
Q203: A monopoly's profit can be calculated as:<br>A)(Price
Q204: Graph 15-3 <img src="https://d2lvgg3v3hfg70.cloudfront.net/TB8859/.jpg" alt="Graph 15-3
Q205: A monopoly generates inefficiency because:<br>A)the high prices
Q206: An industry is a natural monopoly when
Q207: If a monopolist sells 200 units at
Q208: A monopolist is a price:<br>A)setter, and therefore
Q209: Graph 15-6 <img src="https://d2lvgg3v3hfg70.cloudfront.net/TB8859/.jpg" alt="Graph 15-6
Q210: The profit-maximising level of output for a
Q212: The main differences between a competitive firm