Multiple Choice
Graph 15-4 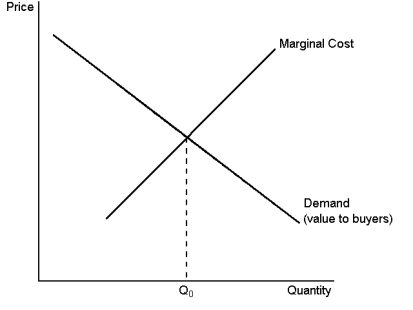 This graph depicts the demand and marginal-cost curves of a profit-maximising monopolist.Use the graph to answer the following question(s) .
-Refer to Graph 15-4.If the monopoly operates at an output level below q₀, decreasing output would:
A) raise the price and raise total surplus
B) lower the price and raise total surplus
C) raise the price and lower total surplus
D) lower the price and lower total surplus
Correct Answer:

Verified
Correct Answer:
Verified
Q180: Apple is likely to charge a price
Q181: Given that monopoly firms do not have
Q182: Refer to the information provided.Jack, the sole
Q183: For a monopolist, when does marginal revenue
Q184: According to the information provided, suppose only
Q186: An appropriate way to measure the economic
Q187: In theory, perfect price discrimination:<br>A)increases the monopolist's
Q188: The key difference between a competitive firm
Q189: Where does the marginal-revenue curve for a
Q190: Price discrimination is a rational strategy for