Multiple Choice
Graph 13-1 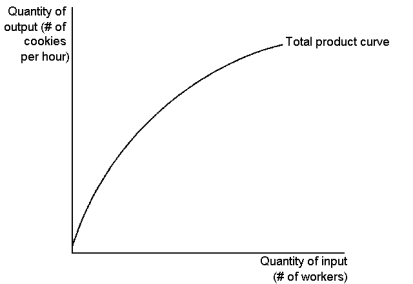 This graph depicts a production function for a firm that produces cookies.Use the
graph to answer the following question(s) .
-Refer to Graph 13-1.With regard to cookie production, the figure implies:
A) decreasing cost of cookie production
B) diminishing marginal product of workers
C) increasing marginal product of workers
D) diminishing marginal cost of cookie production
Correct Answer:

Verified
Correct Answer:
Verified
Q67: Jeremy, a small business owner, earns $50
Q68: The long-run average total cost curve is:<br>A)flatter
Q69: Which of these will always be the
Q70: Suppose that as a firm expands and
Q71: Table 13-2<br>Adrienne's Premium Boxing Service subcontracts with
Q73: Economic profit is equal to:<br>A)total revenue minus
Q74: Accounting profit is equal to:<br>A)total revenue minus
Q75: Table 13-1<br>Measures of Cost for Splashy Cardboard
Q76: A sawmill processes logs into timber.Identify the
Q77: Table 13-1<br>Measures of Cost for Splashy Cardboard