Multiple Choice
Graph 13-2 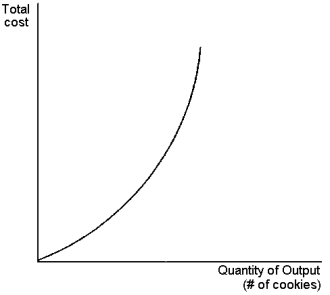 This graph depicts a total cost function for a firm that produces cookies.Use the graph to answer the following question(s) .
-Refer to Graph 13-2.Which of the statements below is most consistent with the shape of the total cost curve?
A) producing additional cookies is equally costly, regardless of how many cookies are already being produced
B) producing additional cookies becomes increasingly costly only when the number of cookies already being produced is large
C) producing an additional cookie is always more costly than producing the previous cookie
D) total production of cookies decreases with additional units of input
Correct Answer:

Verified
Correct Answer:
Verified
Q77: Accountants keep track of the money that
Q85: The shape of the total-cost curve is
Q160: Table 13-1<br>Measures of Cost for Splashy Cardboard
Q161: Thirsty Thelma owns and operates a small
Q162: Graph 13-1 <img src="https://d2lvgg3v3hfg70.cloudfront.net/TB8859/.jpg" alt="Graph 13-1
Q163: Table 13-2<br>Adrienne's Premium Boxing Service subcontracts with
Q164: If a firm wants to capitalise on
Q168: Average total cost necessarily rises due to
Q169: Graph 13-6 <img src="https://d2lvgg3v3hfg70.cloudfront.net/TB8859/.jpg" alt="Graph 13-6
Q170: Define the Law of Diminishing returns: