Multiple Choice
Graph 13-2 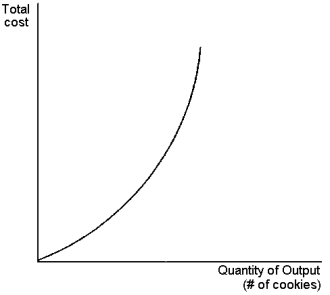 This graph depicts a total cost function for a firm that produces cookies.Use the graph to answer the following question(s) .
-Refer to Graph 13-2.Identify the true statements from the list below.(i) the marginal cost of cookie production is increasing
(ii) cookie production exhibits diminishing marginal product
(iii) the slope of the production function increases as quantity of inputs increase
A) (i) only
B) (ii) and (iii)
C) (i) and (iii)
D) (i) , (ii) and (iii)
Correct Answer:

Verified
Correct Answer:
Verified
Q115: Table 13-3<br>Consider the following firm which makes
Q116: The amount of money that a firm
Q117: Economists normally assume that a firm would?<br>(i)
Q118: A firm's variable costs divided by the
Q119: Diminishing marginal product causes the average variable
Q121: The cost of capital includes both any
Q122: Harry's Hotdogs is a small street vendor
Q123: At low output levels a firm's average
Q124: Table 13-3<br>Consider the following firm which makes
Q125: Profit plus total costs equals:<br>A)total revenue<br>B)net profit<br>C)capital