Multiple Choice
Graph 13-5 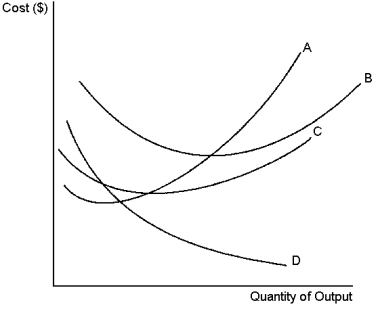 The set of curves above reflect information about the cost structure of a firm.Use this graph to answer the following question(s) .
-Refer to Graph 13-5.Which of the curves is most likely to represent marginal cost?
A) A
B) B
C) C
D) D
Correct Answer:

Verified
Correct Answer:
Verified
Q31: The cost of producing an additional unit
Q47: Which of the following would be categorised
Q48: According to the information provided, what is
Q49: According to the information provided, Jack's production
Q50: Marginal cost equals which of the following?<br>(i)
Q51: Total revenue equals:<br>A)total output multiplied by the
Q53: The use of specialisation to achieve economies
Q54: Table 13-3<br>Consider the following firm which makes
Q55: Harry Hoarder runs a small street vendor
Q57: Economies of scale arise when:<br>A)workers are able