Multiple Choice
Graph 13-6 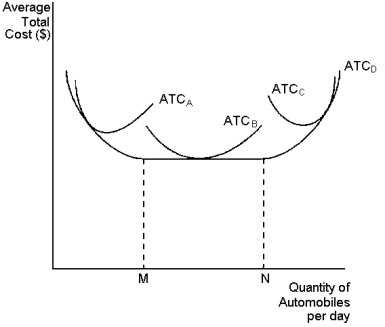 This graph depicts average total cost functions for a firm that produces automobiles.Use the graph to answer the following question(s) .
-Refer to Graph 13-6.Which of the curves is most likely to characterise the short-run average total cost curve of the biggest factory?
A) ATCA
B) ATCB
C) ATCC
D) ATCD
Correct Answer:

Verified
Correct Answer:
Verified
Q141: A key difference between accountants and economists
Q146: Graph 13-6 <img src="https://d2lvgg3v3hfg70.cloudfront.net/TB8859/.jpg" alt="Graph 13-6
Q147: To an economist, the field of industrial
Q148: One of the most important properties of
Q149: Diminishing marginal product suggests that the marginal:<br>A)product
Q150: A U-shaped long-run average total cost curve
Q152: If a firm is operating at an
Q154: Diminishing marginal product of labour is NOT
Q155: Graph 13-3 <img src="https://d2lvgg3v3hfg70.cloudfront.net/TB8859/.jpg" alt="Graph 13-3
Q156: Which of the following is an implicit