Multiple Choice
Graph 13-6 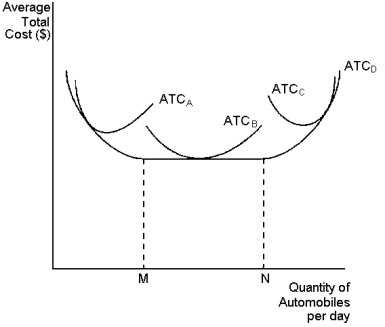 This graph depicts average total cost functions for a firm that produces automobiles.Use the graph to answer the following question(s) .
-Refer to Graph 13-6.Which curve represents the long-run average total cost?
A) ATCA
B) ATCB
C) ATCC
D) ATCD
Correct Answer:

Verified
Correct Answer:
Verified
Q60: The marginal cost curve crosses the average
Q61: Lettuce Eat, a vegetarian cafe, exhibits diminishing
Q62: Table 13-1<br>Measures of Cost for Splashy Cardboard
Q63: During the summer Jeremy, a small business
Q64: Julia runs a home construction business and
Q66: Table 13-1<br>Measures of Cost for Splashy Cardboard
Q67: Jeremy, a small business owner, earns $50
Q68: The long-run average total cost curve is:<br>A)flatter
Q69: Which of these will always be the
Q70: Suppose that as a firm expands and