Multiple Choice
Graph 10-1 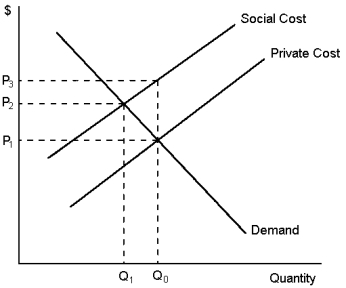
-Refer to Graph 10-1.In the figure shown, an optimal government policy would be a tax on production to the value of:
A) P₃ - P₁
B) P₃ - P₂
C) The value of the optimal tax cannot be measured
Correct Answer:

Verified
Correct Answer:
Verified
Related Questions
Q179: Which of the following is true of
Q180: When private solutions fail to arise, an
Q181: Assume that your housemate is very messy.Suppose
Q182: Siobhan loves it when there are dried
Q183: Some environmentalists argue that we should protect
Q185: While economists generally agree that markets are
Q186: In many cities, a congestion levy is
Q187: If the marginal consumer values timber less
Q188: At any given quantity, the willingness to
Q189: Education has negative externalities for society.