Multiple Choice
Graph 10-3 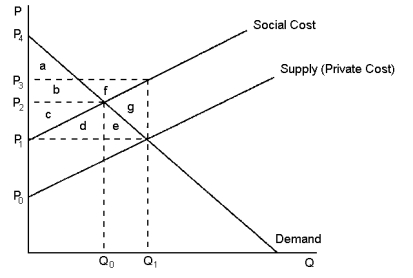 This graph reflects the market for kiwifruit, where pesticide used by kiwifruit orchardists also unintentionally kills honey bees.
-Refer to Graph 10-3.What price and quantity combination best represents the optimum price and number of kiwifruit trays that should be produced?
A) P₁, Q₁
B) P₂, q₀
C) P₃, Q₁
D) The optimum quantity is zero kiwifruit as long as honey production by beekeepers is lower because of pesticide use.
Correct Answer:

Verified
Correct Answer:
Verified
Q141: Internalising a negative consumption externality will cause
Q142: Which of the following could be associated
Q143: Suppose people plant flowering trees near their
Q144: Which of the following is one problem
Q145: Which policy would best suit a positive
Q147: Graph 10-4 <img src="https://d2lvgg3v3hfg70.cloudfront.net/TB8859/.jpg" alt="Graph 10-4
Q148: When the government chooses an externality policy
Q149: Katie owns a rabbit which loves to
Q150: Tim and Tom are having an argument
Q151: The height of the supply curve at