Multiple Choice
Graph 10-3 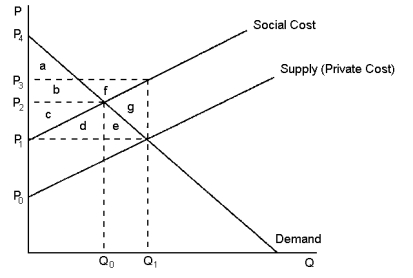 This graph reflects the market for kiwifruit, where pesticide used by kiwifruit orchardists also unintentionally kills honey bees.
-Refer to Graph 10-3.The producer surplus derived from the most efficient kiwifruit production levels is represented by the area:
A) g
B) e + g
C) a + b
D) a + b + c
Correct Answer:

Verified
Correct Answer:
Verified
Q33: A broad-based carbon tax may be preferred
Q34: The ability of individuals to arrive at
Q35: Charities are an example of a private
Q36: The size and scope of technology spillovers
Q37: Graph 10-5 <img src="https://d2lvgg3v3hfg70.cloudfront.net/TB8859/.jpg" alt="Graph 10-5
Q39: Graph 10-4 <img src="https://d2lvgg3v3hfg70.cloudfront.net/TB8859/.jpg" alt="Graph 10-4
Q40: Graph 10-3 <img src="https://d2lvgg3v3hfg70.cloudfront.net/TB8859/.jpg" alt="Graph 10-3
Q41: Government can internalise an externality by taxing
Q42: What is the Coase theorem? What are
Q43: Which of the following policies is government