Multiple Choice
Graph 10-5 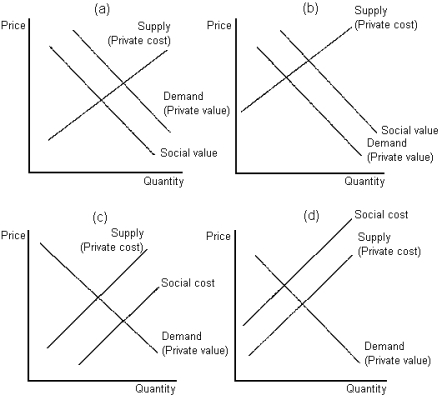
-Refer to Graph 10-5.Which of the graphs shown best depicts the case of a negative production externality?
A) panel (a)
B) panel (b)
C) panel (c)
D) panel (d)
Correct Answer:

Verified
Correct Answer:
Verified
Related Questions
Q107: Consider a local factory that pollutes a
Q108: Dick owns a dog whose barking annoys
Q109: What is an externality? Give three examples
Q110: Because a driver's private motoring costs do
Q111: Graph 10-3 <img src="https://d2lvgg3v3hfg70.cloudfront.net/TB8859/.jpg" alt="Graph 10-3
Q113: When the government reverts to command-and-control policy
Q114: If the government were to decide that
Q115: The distribution of rights among parties affected
Q116: Assuming that transaction costs are small, the
Q117: The externality associated with the consumption of