Multiple Choice
Graph 10-5 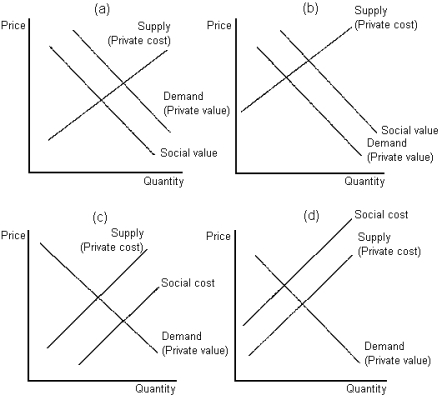
-Refer to Graph 10-5.Which of the graphs shown best depicts the case of a positive production externality?
A) panel (a)
B) panel (b)
C) panel (c)
D) panel (d)
Correct Answer:

Verified
Correct Answer:
Verified
Related Questions
Q27: Taxation is often able to correct market
Q28: In France, drivers in one central region
Q29: Organisers of an outdoor concert in a
Q30: A local cafe that allowed patrons to
Q31: Private markets fail to reach a socially
Q33: A broad-based carbon tax may be preferred
Q34: The ability of individuals to arrive at
Q35: Charities are an example of a private
Q36: The size and scope of technology spillovers
Q37: Graph 10-5 <img src="https://d2lvgg3v3hfg70.cloudfront.net/TB8859/.jpg" alt="Graph 10-5