Multiple Choice
Graph 10-5 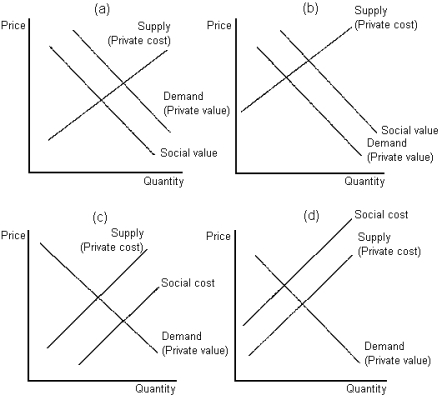
-Refer to Graph 10-5.Which of the graphs shown best depicts the case of a negative consumption externality?
A) panel (a)
B) panel (b)
C) panel (c)
D) panel (d)
Correct Answer:

Verified
Correct Answer:
Verified
Related Questions
Q19: A Pigovian tax:<br>A)allocates pollution to those factories
Q20: Inventors in developing countries are usually unable
Q21: Both pollution permits and Pigovian taxes are
Q22: Government intervention in the economy that aims
Q23: To produce honey, beekeepers place hives of
Q25: When regulating a market in which an
Q26: Which of the following are characteristics of
Q27: Taxation is often able to correct market
Q28: In France, drivers in one central region
Q29: Organisers of an outdoor concert in a