Multiple Choice
Graph 10-5 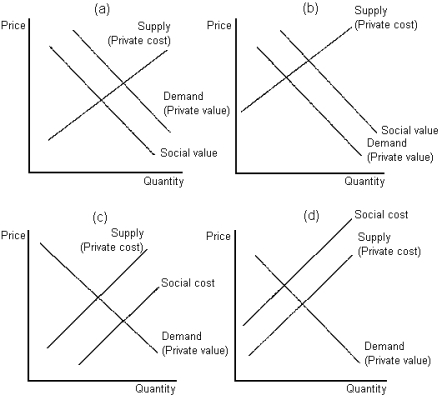
-Refer to Graph 10-5.Which of the graphs shown best depicts the case of a positive consumption externality?
A) panel (a)
B) panel (b)
C) panel (c)
D) panel (d)
Correct Answer:

Verified
Correct Answer:
Verified
Q157: Graph 10-1 <img src="https://d2lvgg3v3hfg70.cloudfront.net/TB8859/.jpg" alt="Graph 10-1
Q158: The Coase theorem suggests that private solutions
Q159: Market outcomes cannot be improved by government
Q160: Pigovian taxes enhance efficiency but the cost
Q161: In which of the following ways are
Q163: The most efficient way to achieve reductions
Q164: Consider the following negative production externality as
Q165: In Australia, hunting regulations for kangaroos are
Q166: Negative consumption externalities will have a socially
Q167: One advantage of allowing a market for