Multiple Choice
Graph 8-1 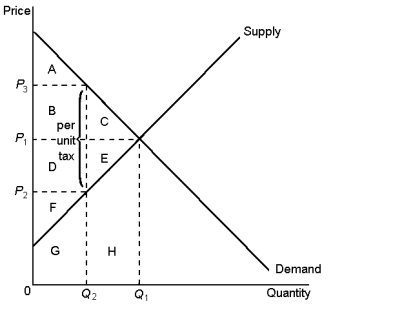
-According to Graph 8-1, the tax caused a reduction in producer surplus, it is represented by area:
A) A
B) B + C
C) D + E
D) F
Correct Answer:

Verified
Correct Answer:
Verified
Related Questions
Q46: Taxes on labour encourage all of the
Q47: What is the relationship between a change
Q48: The deadweight loss of taxation may be
Q49: Suppose the Government is looking to raise
Q51: Tax cuts and deregulation may cause output
Q53: According to the information provided, assume that
Q54: Assume that the demand for salt is
Q55: Graph 8-1 <img src="https://d2lvgg3v3hfg70.cloudfront.net/TB8859/.jpg" alt="Graph 8-1
Q103: A tax raises the price received by
Q108: Economists disagree on whether labour taxes have