Multiple Choice
Graph 8-1 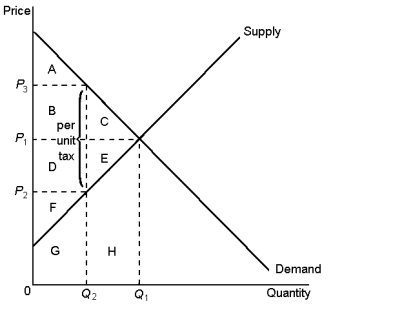
-According to Graph 8-1, the total surplus (consumer, producer, and government) with the tax is represented by area:
A) A + B + C
B) D + E + F
C) A + B + D + F
D) C + E
Correct Answer:

Verified
Correct Answer:
Verified
Q97: According to the information provided, the total
Q98: A tax levied on the buyers of
Q99: Graph 8-3 <img src="https://d2lvgg3v3hfg70.cloudfront.net/TB8859/.jpg" alt="Graph 8-3
Q100: Graph 8-1 <img src="https://d2lvgg3v3hfg70.cloudfront.net/TB8859/.jpg" alt="Graph 8-1
Q101: There is little evidence that the Australian
Q103: Graph 8-3 <img src="https://d2lvgg3v3hfg70.cloudfront.net/TB8859/.jpg" alt="Graph 8-3
Q104: Graph 8-3 <img src="https://d2lvgg3v3hfg70.cloudfront.net/TB8859/.jpg" alt="Graph 8-3
Q105: Assume that a tax is levied on
Q106: The higher a country's tax rates, the
Q160: The deadweight loss of a tax rises