Multiple Choice
Graph 8-2 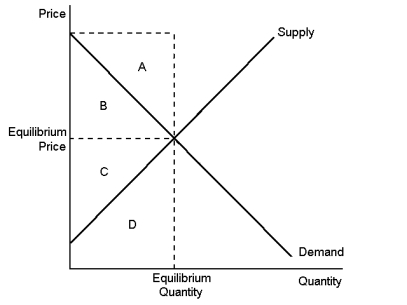 This graph shows supply and demand in a free market.
-According to Graph 8-2, if the market is in equilibrium, consumer surplus is represented by area:
A) A
B) B
C) C
D) D
Correct Answer:

Verified
Correct Answer:
Verified
Q9: Often,the tax revenue collected by the government
Q72: A tax places a wedge between the
Q81: The marginal tax rate on labour income
Q82: A tax on luxuries will create a
Q83: Graph 8-3 <img src="https://d2lvgg3v3hfg70.cloudfront.net/TB8859/.jpg" alt="Graph 8-3
Q84: Graph 8-3 <img src="https://d2lvgg3v3hfg70.cloudfront.net/TB8859/.jpg" alt="Graph 8-3
Q85: Graph 8-1 <img src="https://d2lvgg3v3hfg70.cloudfront.net/TB8859/.jpg" alt="Graph 8-1
Q87: Sachin has agreed to mow his sister
Q90: Since the amount of land is fixed,
Q91: Taxes cause inefficiencies only when government revenue