Multiple Choice
Graph 8-2 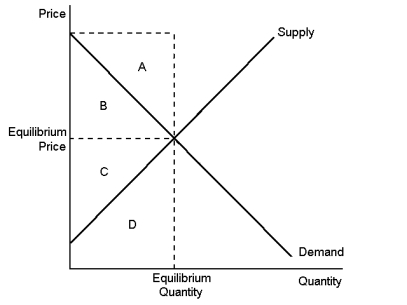 This graph shows supply and demand in a free market.
-According to Graph 8-2, when the market is in equilibrium, producer surplus is represented by area:
A) A
B) B
C) C
D) D
Correct Answer:

Verified
Correct Answer:
Verified
Q53: According to the information provided, assume that
Q54: Assume that the demand for salt is
Q55: Graph 8-1 <img src="https://d2lvgg3v3hfg70.cloudfront.net/TB8859/.jpg" alt="Graph 8-1
Q56: One of the important economic costs of
Q58: Graph 8-3 <img src="https://d2lvgg3v3hfg70.cloudfront.net/TB8859/.jpg" alt="Graph 8-3
Q59: If the supply of land is fixed,
Q60: The greater the elasticities of demand and
Q61: According to the famous economist Milton Friedman,
Q62: 'Assume that the supply of forest products
Q108: Economists disagree on whether labour taxes have