Multiple Choice
Graph 8-3 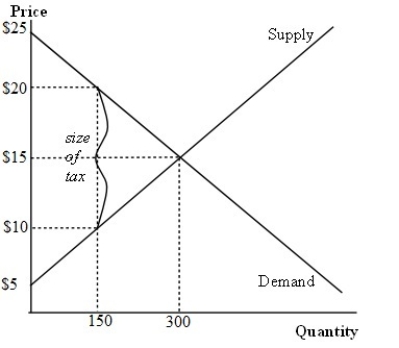
-According to Graph 8-3, the reduction in consumer surplus caused by the tax is:
A) $750
B) $1125
C) $375
D) $1000
Correct Answer:

Verified
Correct Answer:
Verified
Related Questions
Q1: The Laffer curve:<br>A)relates income tax rates to
Q2: Assume that a tax is levied on
Q3: According to the information provided, assume that
Q4: When a tax is levied on a
Q5: If the supply of labour is inelastic,
Q7: Economists generally agree that the most important
Q9: What factors must be taken into account
Q10: Suppose a tax is imposed on a
Q11: Graph 8-1 <img src="https://d2lvgg3v3hfg70.cloudfront.net/TB8859/.jpg" alt="Graph 8-1
Q222: Although tax revenue eventually begins to fall