Multiple Choice
table given below shows the Consumer Price Index (CPI) for selected years. Use a graphing utility to plot the data and graph the model
A) 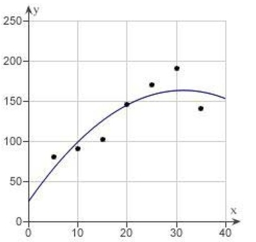
B) 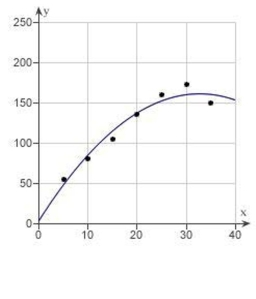
C) 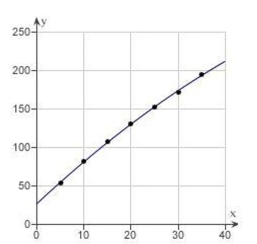
D) 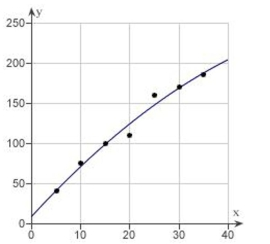
E) 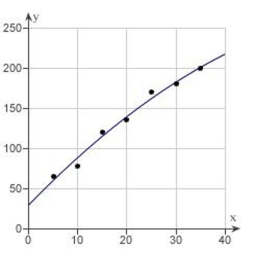
Correct Answer:

Verified
Correct Answer:
Verified
Related Questions
Q88: <span class="ql-formula" data-value="\text { What is the
Q89: <span class="ql-formula" data-value="\text { Evaluate (if possible)
Q90: Students in a lab measured the
Q91: <span class="ql-formula" data-value="\text { Find } f
Q92: <span class="ql-formula" data-value="\text { Which of the
Q94: <span class="ql-formula" data-value="\text { Evaluate the function
Q95: Sketch the graph of the equation:
Q96: <span class="ql-formula" data-value="\text { Sketch a graph
Q97: Determine whether the function is even,
Q98: Table given below shows the Consumer