Multiple Choice
V8 car engine is coupled to a dynamometer and the horsepower y is measured at different engine speeds (in thousands of revolutions per minute) . The results are shown in the table below. Use a graphing utility to plot the data and graph the cubic model.
A) 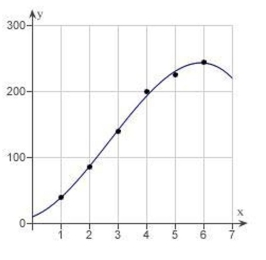
B) 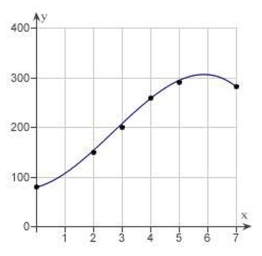
C) 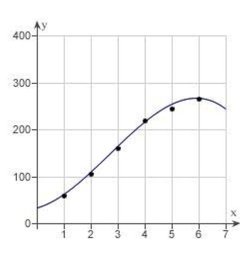
D) 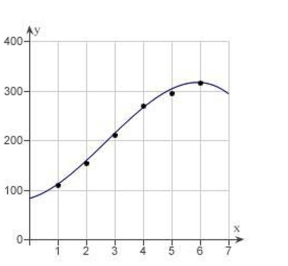
E) 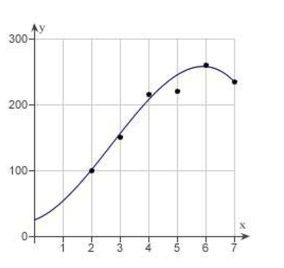
Correct Answer:

Verified
Correct Answer:
Verified
Q38: Hooke's Law states that the force
Q39: <span class="ql-formula" data-value="\text { Find } f
Q40: <span class="ql-formula" data-value="\text { Solve the following
Q41: <span class="ql-formula" data-value="\text { Use the functions
Q42: Solve the following equation for .
Q44: <span class="ql-formula" data-value="\text { Find } f
Q45: <span class="ql-formula" data-value="\text { Specify a sequence
Q46: <span class="ql-formula" data-value="\text { Write an equation
Q47: moving conveyor is built to rise
Q48: <span class="ql-formula" data-value="\text { Find } f