Multiple Choice
The diagram below shows upper and lower sums for the function using 4 subintervals. Use upper and lower sums to approximate the area of the region using the 4 subintervals. 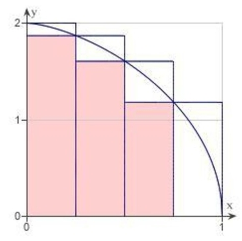
A) lower: ; upper:
B) lower: ; upper:
C) lower: ; upper:
D) lower: ; upper:
Correct Answer:

Verified
Correct Answer:
Verified
Q157: Apply the Trapezoidal Rule and Simpson's
Q158: Find the indefinite integral of the
Q159: Solve the differential equation. <span
Q160: Evaluate the following definite integral.
Q161: Find the limit. <span class="ql-formula"
Q162: <span class="ql-formula" data-value="\text { Find the area
Q163: <span class="ql-formula" data-value="\text { The rate of
Q164: Find the smallest n such that
Q165: Find the indefinite integral. <span
Q167: Use left endpoints and 12 rectangles