Multiple Choice
The figure below shows a sine wave at one point of a string as a function of time.

Use the exhibit to answer the following question(s) .
- Which of the graphs below shows a wave where the amplitude and the frequency are doubled?
A) 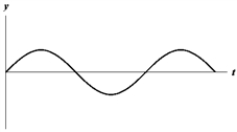
B) 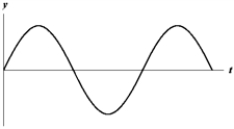
C) 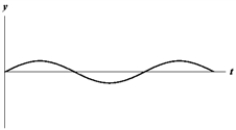
D) 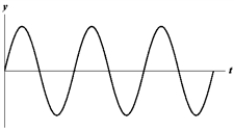
E) 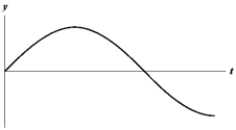
Correct Answer:

Verified
Correct Answer:
Verified
Q9: If y = 0.02 sin (30x −
Q17: For the wave described by <img src="https://d2lvgg3v3hfg70.cloudfront.net/TB8847/.jpg"
Q19: A 100-m long transmission cable is suspended
Q21: For the wave described by <img src="https://d2lvgg3v3hfg70.cloudfront.net/TB8847/.jpg"
Q24: <br>The figure below shows a sine wave
Q24: An earthquake emits both S-waves and P-waves
Q26: The wave equation is written down in
Q39: You are holding on to one end
Q44: If y = 0.02 sin (30x −
Q76: Transverse waves are traveling on a 1.00-m