Multiple Choice
The figure below shows a sine wave on a string at one instant of time.
Use this exhibit to answer the following question(s) .
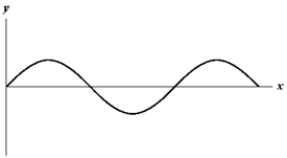
-Which of the graphs below shows a wave where the frequency and wave velocity are both doubled?
A) 
B) 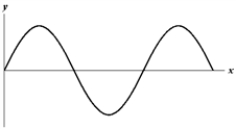
C) 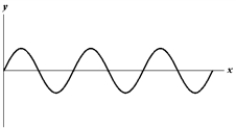
D) 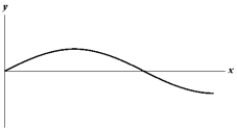
E) 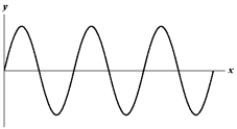
Correct Answer:

Verified
Correct Answer:
Verified
Q2: For the transverse wave described by <img
Q3: Earthquake waves are classified as P waves
Q6: A circus performer stretches a tightrope between
Q6: The equation <img src="https://d2lvgg3v3hfg70.cloudfront.net/TB8847/.jpg" alt="The equation
Q9: <br>Four wave functions are given below.<br>I.y(x, t)
Q17: Suppose that you were selected for a
Q19: For the wave described by y =
Q20: You are holding on to one end
Q36: A student attaches a length of nylon
Q53: A piano string of density 0.005 0