Multiple Choice
The graph below shows a plot of angular velocity in rad/s versus time in s from t = 0 s to t = 7 s.
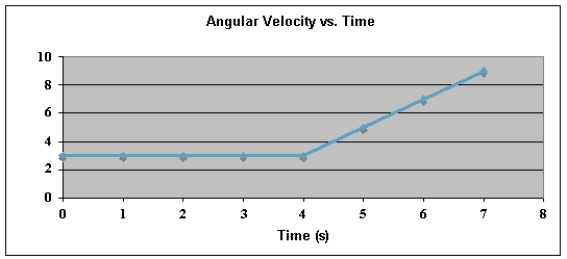
Use this exhibit to answer the following question(s) .
-The change in angular position, Δθ, during the 7-second period is
A) 21 rad, CW.
B) 21 rad, CCW.
C) 30 rad, CW.
D) 30 rad, CCW.
E) 39 rad, CCW.
Correct Answer:

Verified
Correct Answer:
Verified
Related Questions
Q1: <br>The figure below shows a graph of
Q5: <br>The figure below shows a graph of
Q10: The graph below shows a plot of
Q11: Which of the following diagrams shows the
Q20: A wheel rotating about a fixed axis
Q22: Particles (mass of each = 0.20 kg)
Q24: A wheel rotates about a fixed axis
Q42: At t = 0, a wheel rotating
Q48: A wheel rotates about a fixed axis
Q69: When a wheel is rolling without slipping,