Multiple Choice
Use the table to estimate the rate of change of y at the specified value of x.
-When exposed to ethylene gas, green bananas will ripen at an accelerated rate. The number of days for ripening becomes shorter for longer exposure times. Assume that the table below gives average ripening times of
Bananas for several different ethylene exposure times. 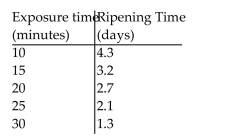 Plot the data and then find a line approximating the data. With the aid of this line, determine the rate of change of Ripening time with respect to exposure time. Round your answer to two significant digits.
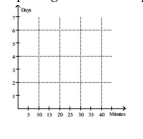
A) 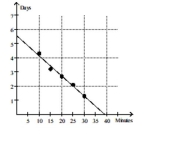
days per minute
B) 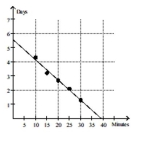
days
C) 
38 minutes
D) 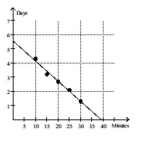
-0.14 day per minute
Correct Answer:

Verified
Correct Answer:
Verified
Q94: <span class="ql-formula" data-value="\text {
Q95: Use the graph to estimate the
Q96: Provide an appropriate response.<br>-It can be
Q97: Provide an appropriate response.<br>-If <span
Q98: Use the table to estimate the
Q100: Use the graph to evaluate the
Q101: Find the limit <span
Q102: Use the table to estimate the
Q103: Provide an appropriate response.<br>-The statement "the limit
Q104: Provide an appropriate response.<br>-Given <span